- Please note that this article is a translated version of the original article I’ve written in Sept 26th 2022.
- 웹3.0 인프라의 수익(Revenue)과 가능성을 알아보자- 2편 더 그래프 (GRT) by @BQCryptoKorea https://link.medium.com/BtHBMvzHLEb
INTRO — Parabolic Uptrend in the Revenue of GRT Network
If you haven’t seen Part 1, the overall introduction is included in it, so please make sure to take a look before reading the below article.
https://link.medium.com/UjIslqxfNsb
In Part 2, we’ll delve into a discussion about GRT, The Graph
MESSARI
The first notable data to pay attention to is the staggering revenue increase of GRT revealed in this 2022 Q2 Web 3.0 infrastructure revenue summary report.
The GRT protocol, which generated around $17K in revenue in 2021 Q4, saw a decrease to about $5K in 2022 Q1. However, the most recent data from 2022 Q2 indicates a significant spike in demand-side revenue, reaching approximately $57K. This presents a highly interesting trend.

MESSARI
“In this 2022 Q2 period, the fully diluted valuation (FDV) dropped by about -80%, showing a trend closely resembling the market cap changes of various Web 3.0 infrastructure projects. However, on the flip side, while the market cap changes were similar, the revenue surged dramatically from $5K to a whopping $57K, confidently positioning itself between LPT and Stroj.
This is an incredibly intriguing aspect. However, it’s crucial to explore whether this revenue increase actually signifies substantial and meaningful growth.
GRT, The Graph, The Google of blockchain? What is the Graph?
Before delving into the discussion, I believe it’s essential to cover the basics of what The Graph (GRT) project is.
The Graph is fundamentally an indexing infrastructure project.
Indexing, at its core, is a method that enables the swift retrieval of information.
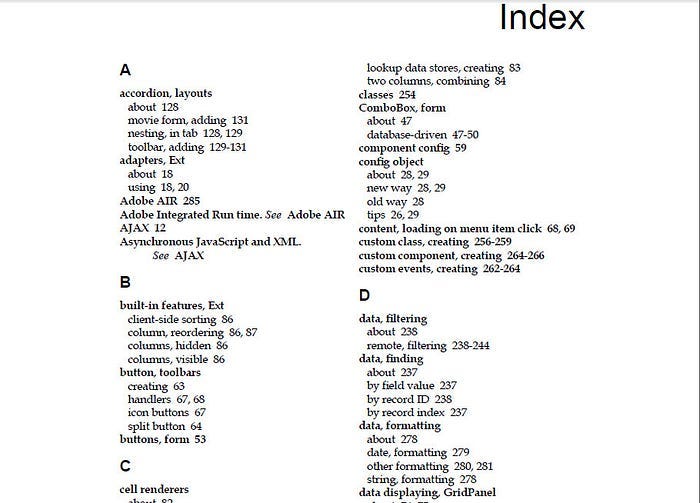
https://stackoverflow.com/questions/17272050/book-index-page-layout-using-html5-and-css
When you encounter thick books that are difficult to read and cause stress, you often find a section called ‘index’ at the back. In this index, each letter shows which page it appears on, allowing you to quickly navigate to the desired page using keywords and easily read the content.
Similarly, The Graph plays a role similar to the index of these books in the blockchain world.

https://www.ledger.com/academy/how-does-a-blockchain-transaction-work
“In blockchain, to find past transaction records or smart contracts, we need to read through all the data starting from the first block to check if the relevant information is there. Naturally, considering there could be tens of millions of blocks, manually doing this from scratch would result in an immense waste of time. The issue lies in the fact that most DApps struggle to store and retrieve these records easily, making their operation challenging.
To address this, a well known approach involves copying and separately storing the data from all the blocks to create a database, allowing users to easily search and access information.

An exemplary case is Etherscan, which we often use. It’s one of the data service platforms that fetches and provides all transaction records from the blocks in real-time to a centralized database.
Certainly, platforms like Etherscan, among various blockchain explorers (Ingestion Services), are convenient and intuitive. However, they inherently carry the risk of being centralized databases.
What if Etherscan suddenly shuts down? What if it transitions to a paid service? What if I don’t trust Etherscan’s company? What if my project gets blacklisted and denied API access? If a decentralized app relies on centralized indexing?
To address these risks, The Graph (GRT) emerged. It acts as an indexing/querying project using decentralized API protocols to fetch blockchain data.
Interpreting The Graph (GRT) as a protocol that organizes and makes it easy to access various areas/types of needed data through a language called GraphQL would be a easy way to understand The Graph.

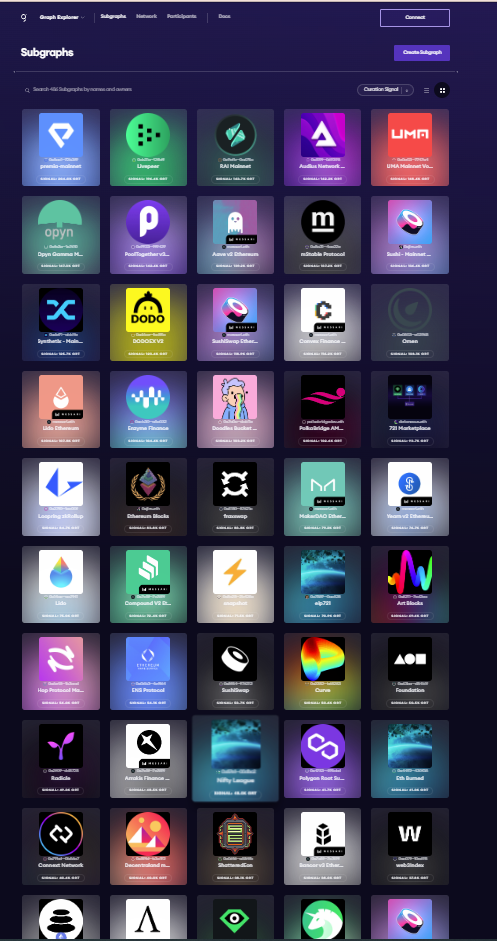
Currently, numerous decentralized applications (dApps) are utilizing the GRT infrastructure for their operations, and the numbers are consistently increasing every month.
The Structure of The Graph
To understand The Graph’s structure easily, it might be helpful to look at the various entities with different roles within GRT network.

https://thegraph.com/blog/the-graph-grt-token-economics/
- Indexer
These are the entities running GRT nodes and staking GRT to operate nodes. They index Subgraphs.
Subgraph = Extracts and stores blockchain data, enables convenient data retrieval (Query) through GraphQL
They receive requests for data retrieval and are compensated for processing work.
2. Consumers
They pay fees to indexers (from point 1) and retrieve data. Various customers exist, such as users, dApps, web services, etc.
3. Curator
Curators analyze various Subgraphs and can allocate their GRT to Subgraphs they consider valuable. In return, they receive a portion of the fees generated from queries on the Subgraph.
Subgraphs are open-source, and with thousands existing, an incentive structure exists to distinguish valuable data from non-valuable data.
4. Delegators
These individuals stake their GRT tokens to indexers (from point 1) and receive a portion of the fees earned by indexers. They don’t need to run nodes themselves, making it a straightforward staking method.
5. Fisherman
Fishermen monitor whether indexers (from point 1) correctly process queries. If an indexer manipulates or incorrectly transmits data, a fisherman can raise objections.
To raise objections, they typically need to stake GRT (10,000 GRT). If the objections are valid, they receive 50% of the staked GRT as compensation (the remaining 50% gets burned).
If objections are raised without confirmation and proven wrong, the staked GRT gets taken away and burned.
6. Arbitrator
These roles are elected through DAO and are responsible for validating objections raised by fishermen. They decide on indexers’ behavior in cases where on-chain validation is challenging and difficult.
To explain the structure a bit more simply:
- Curators analyze numerous Subgraphs, studying and depositing GRT in the ones they find promising (compensated with a portion of indexers’ rewards).
- Indexers review the GRT deposited by curators (from 1.), selecting areas where they believe higher fees can be earned. They stake GRT and operate nodes in the subgraph (compensated by consumer fees).
- Delegators deposit their GRT to indexers (from 2.) and earn a share of consumer fees along with indexers.
- When fishermen spot suspicious behavior from indexers, they stake GRT and raise objections. If an indexer is found to be malicious, the staked GRT of the indexer gets slashed, 50% goes to the fisherman, and 50% gets burned. (If objections are false, the staked GRT by the fisherman gets all burned)
- Arbitrators step in when there are objections that can’t be resolved on-chain or where answers aren’t apparent (elected representatives via DAO).
The Tokenomics of GRT, The Graph (supply and demand)
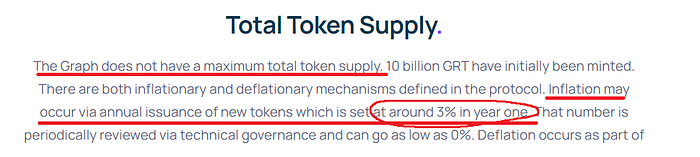
The total supply of GRT tokens is around 10 billion. Various sources marks the maximum supply as 10 billion, but in reality it’s not restricted and could increase further.
As of now, approximately 7.4 billion tokens have been minted, which is around 74% of the total supply (based on Messari)
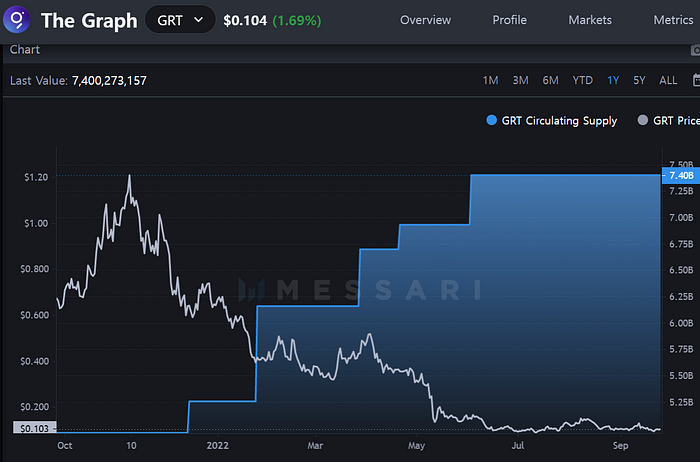
MESSARI
Due to constant releases every two months, there was significant sell pressure on the price. Currently, it seems that this trend is almost over, which is quite welcoming and intriguing. This could indeed be viewed as a very positive change.
Supply of GRT (Supply-1)
Let’s start off with the suppply side of the tokenomics of GRT, which is structured as shown in the diagram below.

https://thegraph.academy/ecosystem/graph-token-economics/

https://thegraph.academy/ecosystem/graph-token-economics/
Let’s first address the tokens that are being unlocked irrespective of the ecosystem activity. As shown in the chart above,
- 23.2% for Team & Advisors
- 16.5% for Initial Backers (VC)
- 17.3% for Backers (VC)
- 20.3% for The Graph Foundation, holding 58% of the Community Pool’s 35%
- 6% for Sale Allocation
- 3% for Testnet Indexer Rewards
- 8% for Edge & Node (Early VC, Team)
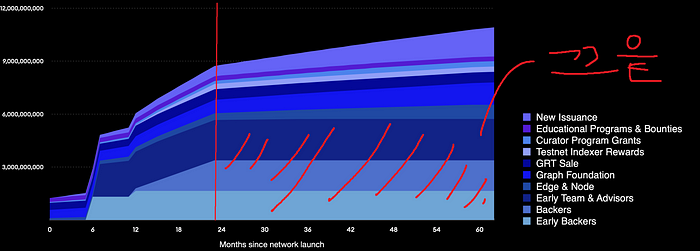
The initial token generation and unlocking began approximately from the mainnet launch on December 17, 2020, making it around 21 months as of September 17, 2022.
The 24-month mark falls on December 17, 2022. (An important date — further elaboration below)
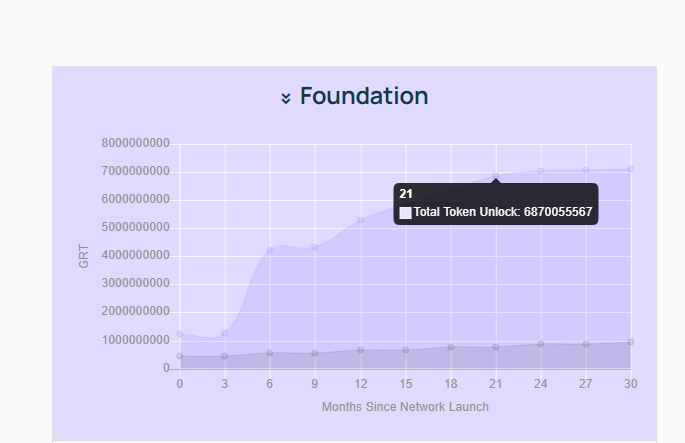
The following graphs illustrate the amount of tokens unlocked for the foundation, team, backers, etc., based on the months after the launch.
https://thegraph.academy/ecosystem/graph-token-economics/
<Foundation Allocation>
At the mainnet launch, 460,000,000 tokens were unlocked, followed by an unlocking of 100,000,000 tokens every six months for ten years.
Simply put: Every six months until December 17, 2030, 100,000,000 tokens are unlocked. (Every June 17th & December 17th annually)
<Backer, Early Investors, Sale Allocation>

The Initial Backers’ allocation has already been fully unlocked, and both the Sale and Backers’ tokens will be fully distributed by the 24-month mark. Though there are three months remaining, for a more straightforward understanding, we’ll consider the 24-month timeline rather than calculating everything for these three months.
Simply put: The remaining amounts for Backers and Sale allocations are being linearly unlocked at present, and as of December 17, 2022, everything will be fully unlocked.
<Early Team Allocation>
For early team members, the total vesting schedule spans over 4 years until December 17, 2024, releasing 287,500,000 tokens every 6 months until then.

Simply put: Every 6 months (June 17th, December 17th) until December 17, 2024, 287,500,000 tokens will be unlocked.
<Edge & Node> Edge & Node Company (https://edgeandnode.com)

For companies like Edge & Node, there’s a 5-year lockup schedule, which means unlocking approximately 70,000,000 tokens every 6 months until December 17, 2025.
Simply put: Every 6 months until December 17 2025, 70,000,000 tokens will be unlocked.
<Testnet Indexer Allocation>
Testnet has been finished long time ago. The allocations are all done.
Supply (Supply-1) — Brief Summary
Supply-1 which soley focuses on the unlocks from investment firms and foundation allocations are as below.
When we set the reference date as December 17, 2022
Foundation Allocation -> 100,000,000 (100m) tokens unlocked every 6 months (until December 17, 2030)
Early Team Members -> 287,500,000 (287m) tokens unlocked every 6 months (until December 17, 2024)
Edge & Node -> 70,000,000 (70m) tokens unlocked every 6 months (until December 17, 2025)
Backers, Early Backers, Sale -> All unlocked
Testnet Indexer -> All unlocked
Conclusion for Supply-1:
From December 17, 2022, in every 6 months, a total of 457.5 million or 457,500,000 GRT tokens will be unlocked.
As for how much has been unlocked before December 17, 2022… Let’s leave that to the imagination.
(There’s a reason for all the chart shapes)

Supply2 of GRT (Supply-2)
Now that we’ve summarized Supply 1, which involves allocations from investment firms, foundations, etc., let’s take a look at Supply 2, which encompasses the ecosystem’s own inflationary aspects.
Supply 2 is essentially the inflation generated within the ecosystem.
In brief, the ecosystem’s inherent inflation rate is around 3%.
Of course, through governance, it’s possible to maintain it to 0% or increase it, but as of now, it seems to be relatively fixed around ~3%.
Many people tend to believe that the total supply of GRT tokens is fixed at 10 billion as marked by platforms like CoinMarketCap or CoinGecko. However, this is incorrect. The initial locked/unlocked tokens amounted to 10 billion, and inflation is measured separately.
This approximate 3% inflation rate is a kind of bonus received by GRT indexer nodes (more like block rewards). As outlined in the structure of GRT discussed earlier, this distribution naturally goes to regular Delegators and Curators who engage in staking.
Summary of GRT’s Supply 1 and 2 (Supply) From December 17, 2022
Every 6 months, 457.5 million or 457,500,000 GRT tokens unlock.(Supply-1)
Approximately 3% inflation annually. (Supply-2)
The Demand side of GRT
Next, let’s delve into where GRT tokens are used and how burning occurs.
The primary demand for GRT is similar to Filecoin’s case discussed in the previous writing:
- DEMAND OF GRT-1: GRT tokens deposited by Indexers (nodes), Delegators handling staking, and staking of Curators for GRT earnings.
[Simply put, these are stake amounts disappearing from the market circulation.]
- DEMAND OF GRT-2: There’s a burning mechanism that occurs through various actions in the network such as Deposit Fees, Query Fees from consumers requesting queries, and Slashing of nodes, resulting in a certain amount being burned.
[Essentially, these quantities are burned and entirely removed from circulation.]
Occasionally, there’s a question:
‘Why aren’t the fees people pay to use the protocol considered as demand?’
In reality, such demand represents the amount paid by users in fees, returned to node/infrastructure providers, effectively re-entering the market as circulating supply. In this article we do not consider it as demand as it has zero affect to the circulating supply.
I view demand in the tokenomics as reducing the circulating supply or decreasing the amount in the market. (Personal perspective)
GRT Demand (Demand-1)
Let’s start by examining the demand for GRT that disappears from the Circulating Supply through staking.

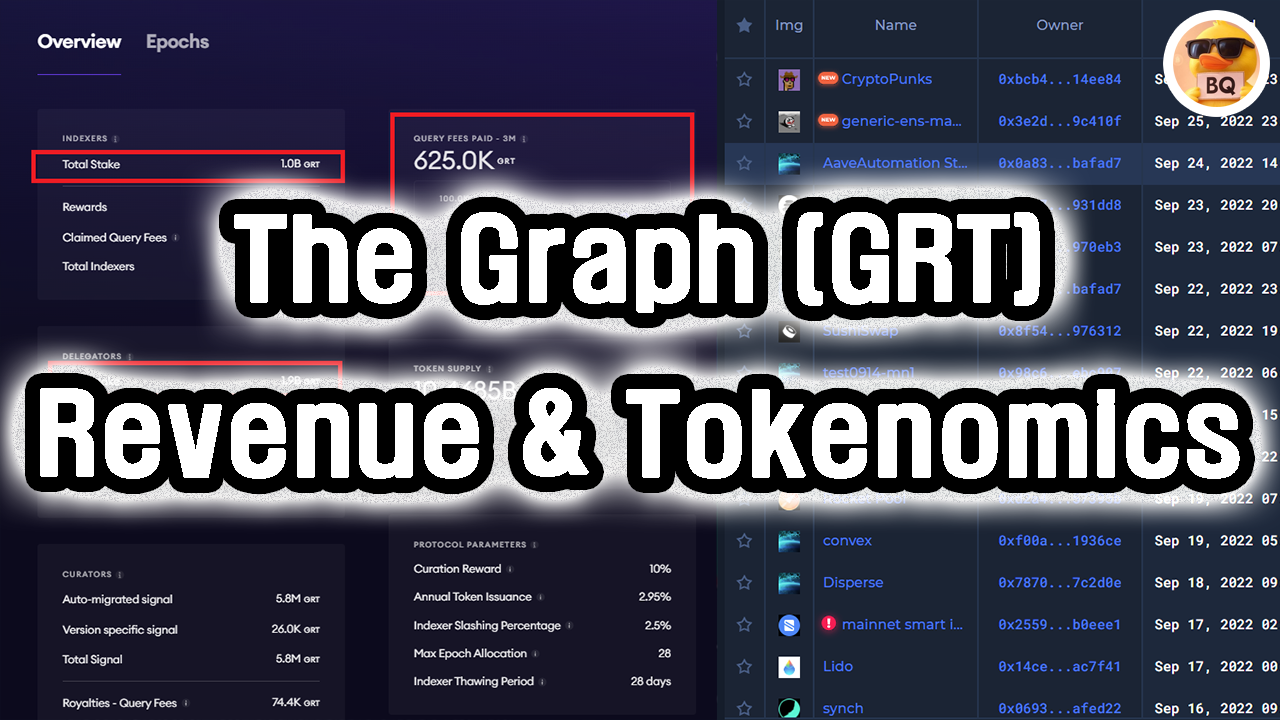
https://thegraph.com/explorer/network
The total node staking amount by Indexers stands at 1.0 billion GRT. Additionally, the staking amount from those who staked for Indexers is 1.9 billion GRT. Finally, the Curators, who stake their amounts to signal their work mentioned earlier, have a stake of 5.8 million GRT.
As expected, these staked amounts will increase in tandem with the increase in GRT activation, meaning more queries leading to the growth in node and Curator numbers.
So, let’s first take a look at the changes in the staked amounts.

https://dune.com/queries/64511/128583
https://messari.io/report/state-of-the-graph-q2-2022
The data covers recent 1 year. The ‘Staked’ represents the staking figures of Indexers (nodes), while the blue ‘Delegated’ above indicates the amount staked by regular delegators to Indexers.
Compared to January last year, there has been an increase of nearly threefold in the staking amount. However, over the past year, it’s been fluctuating between around 2.7 billion and 3 billion. In fact, it’s been relatively stable without significant increases or decreases.
https://messari.io/report/state-of-the-graph-q2-2022

https://graphtronauts.com/#/network
However, on the other hand, the number of Subgraphs has surged by more than 2,350%, and active Indexers have been rapidly increasing around the recent months of August and September.
With this trend, expecting an overall increase in the staking amount.
There’s ongoing progress in launching 24,000 Subgraphs onto the mainnet in Q1 2023, which could significantly boost the system. This presents a somewhat positive view, considering the expiration of sales, backers, and early backer lockups on December 17, 2022, along with the planned migration of large Subgraphs in 2023 Q1.
Might be worth paying attention to the GRT next year…?
Well, in any case, the demand for this staking seems objectively close to zero right now. However, on the flip side, there seems to be considerable potential for the future in the Demand-1 side of GRT.
GRT Demand (Demand-2)
For GRT, a certain percentage of the fees from query requests, in addition to Deposit Fees generated during staking/unstaking, and a portion of the costs arising from slashing malicious nodes, are burned.
Given that it involves burning tokens that disappear not from the market circulation but from the total circulation, I consider it a significant part of the demand.
Anyways, due to the complexity of separately examining the extent of the increase in Query Fees, Deposit Fees, slashing costs, and others, this time too, as a workaround(?), let’s verify the total amount being burned and observe the trends of increase or decrease.

https://thegraph.stake-machine.com/d/gWJAOQsMk/dynamics-report?orgId=1&inspect=22

https://dune.com/queries/65524/130948
Up to now, about 21.72 million tokens have been burned.
As of September 24th, looking at the recent one-year burn:
From September 24, 2021-> 16.49 million tokens burned,
To September 24, 2022 -> 21.75 million tokens burned,
It appears that roughly
5.29 million tokens were burned in one year.
Considering the entire duration, the initial growth was notably strong:
From December 17, 2020 -> 0 tokens burned,
To September 24, 2022 -> 21.75 million tokens burned,
During 21 months, 21.75 million tokens were burned, including the early bullish trend.
On average, about 12.4 million tokens were burned per year
Honestly, the amount being burned currently seems very low. While there’s potential for growth driven by the pace of GRT’s expansion and potential increases in query requests, it remains a possibility rather than a certainty.

https://graphtronauts.com/#/network
The aspect of query request demand highlighted in green has shown a parabolic growth trend since May 2022, which appears promising.
Summary of GRT’s Demand and Supply, and Personal Opinion
Firstly, regarding the supply:
Supply 1: Starting December 17, 2022, every 6 months, 457,500,000 tokens are unlocked. (From December 17, 2024, it drops significantly to 169,500,000, then further to 100,000,000 from December 17, 2026.)
Supply 2: Annual inflation rate of around 3%.
On the demand side:
Demand 1: Staking has not seen significant changes in the last year (an area that needs change). Since mainnet launch, an average of 1,740,000,000 tokens has been staked annually, but this was a boost in the early stages, and the current situation is relatively stable.
Demand 2: Regarding burning, approximately 5,400,000 tokens were burned in the past year,
with an average of about 12,400,000 tokens burned annually
In summary, when we make some assumptions/ estimates to peek through the future:
Annual unlocks = 457,500,000 * 2 = 915,000,000 GRT
Annual inflation rate = ~+3%
Tokens disappearing from the market due to staking = 0(if there’s no significant change like now)
Tokens burned annually = 5,400,000 to 12,400,000 GRT (possibly increasing if the query request growth continues)
Considering different scenarios: (Estimated calculations, please take it lightly.)
Ultimately, if (Supply 1) + (Supply 2) > (Demand 1) + (Demand 2), it could create pressure on the price, and conversely, if it’s the opposite, the price should continue rising.
If there’s no significant new staking volume like now:
Supply :(915,000,000 GRT) [Annunal Unlock]+ (3% APY) [Inflation]
vs
Demand: (0) [Staking]+ (5,400,000 to 12,400,000 GRT) [Burn]
Results in approximately 900,000,000 GRT released annually through staking and almost meaningless tokens being burned, making it impossible for the price to recover.
Roughly speaking, it implies a continuous 12% increase in new supply each year.
Second case estimate: If the current trend of increasing Subgraph numbers and accelerating query requests continues:
Supply remains the same: (915,000,000 GRT) + (3% APY) Demand: (New estimated staking volume) + (estimated 30,000,000 burn)
This scenario suggests more if than 915,000,000 GRT enters through new staking, then it would make it practically impossible for the price to drop.
Whether this new staking volume will come or not largely depends on the growth potential of GRT.
In my opinion. Personally, I find it hard to imagine around 915,000,000 GRT entering the market annually.
Then the question is: Is GRT’s future in darkness?
Based on this, the conclusion drawn might be that
“Perhaps there’s no future for GRT tokens to rise until the unlock schedule ends, so waiting until the unlock finishes might be the best option.”
But the fact is the massive 915,000,000 GRT that gets released each year will decrease significantly starting from 2024, suggesting an opportunity for us to evaluate.
Supply 1 (Token Unlocks)
Starting from December 17, 2022, every 6 months, 457,500,000 tokens will be unlocked.
(Starting from December 17, 2024, this decreases significantly to 169,500,000.)
(Starting from December 17, 2026, it further decreases to 100,000,000.)
It’s undeniably true that as time passes, the potential for GRT’s price would increase with lowering sell pressure.
However, until then, without the mentioned massive new staking or burning, it’s also true that the token remains unattractive in terms of price.
However, this is from a price perspective, and the profit and loss analysis need a slightly different approach. This is incredibly crucial to consider
But there’s an important aspect to consider here. GRT operates on a structure where the 3% inflation rate is paid as an incentive to staked GRT only.
Currently, about one-third of the total volume is staked, meaning Indexers, Delegators, and active participants receive a basic reward of approximately
10.3% APY.
In simple terms, if all GRT holders worldwide start staking, the 3% inflation practically becomes a meaningless supply (as it almost entirely goes back to stakers, not the market), whereas in the current scenario with only one-third staked, it means that one-third is receiving all the share that should go to two-thirds. This also means that the impact of the downturn is considerably less for GRT stakers.
In a scenario with no growth and maintenance: If we assume there’s no significant growth, and hence no new staking, the APY could be measured higher, and after calculations:

For those who stake, they would see a loss of about 6% over a year, indicated by 0.939, and for those who don’t stake, it would be 0.8536, implying roughly a 15% loss in the following year.
Now, let’s assume the opposite scenario: GRT staking increases by around 0.6 billion due to the growth in new indexers and delegators, reaching approximately 20% growth over the next year, driven by the increase in Subgraphs and query requests.

In this scenario, participants engaging in staking might find themselves at around 0.997, effectively not experiencing any losses.
Conversely, those holding tokens without network participation would witness a decrease to about 0.921, resulting in over an 8% loss.
Given the inflation rate remains nearly fixed, the disparity between staking and non-staking users persists.
Staking participants could reach a turning point in profit and loss if there’s an increase of over 0.6 billion in staking quantity (from indexers, Delegators, etc.) from this year to the next.
Though this is just a simulated example, if you’re tracking GRT, it might be wise to occasionally track the areas displayed on the Graph Explorer to calculate your loss and profit according to the staked amount and burns.

Last comments & Conclusion
Personally, I strongly believe that if the unlocked quantities post-December 17, 2022, are accounted. From then on, the GRT ecosystem might present a completely different scenario.
Before the reference date, despite the GRT ecosystem being able to handle more Subgraphs and query operations, the reality is that the increase in circulating supply will significantly larger.
However, after Dec 12 2022, as GRT grows, there might be a noticeably increased likelihood for token holders to benefit.
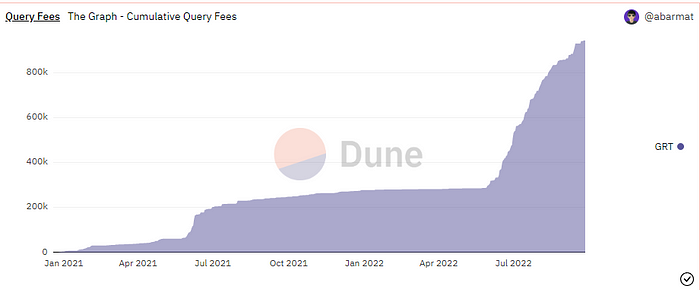
The query fees on The Graph are showing a notably positive trend as more Subgraphs continue to be added. Hence, I believe it might become an interesting sector to keep an eye on in the future.
Additionally, The Graph initially began in 2018 with Edge & Node, focusing on centralized hosting services. Consequently, it still provides centralized hosting services separate from GRT tokens.
The crucial point is that starting from the first quarter of 2023, they aim to completely discontinue these centralized hosting services and migrate everything onto The Graph network
<Hosted Services>
https://thegraph.com/hosted-service
f that happens, there’s a high probability that indexing for various projects, including Ethereum mainnet dApps and those utilizing centralized hosting services, could shift to the decentralized GRT network.
This potential, in my opinion, seems quite substantial, unless they seek out another centralized hosting service.
<New subgraphs becoming onboarded to The Graph>
Initially, I made quite alot of criticism about the “too much token release” in the first half of the writing, so it might seem a bit odd to now speak positively.
However, the approximately 36-fold increase in query fees in 2022 Q2 is also a part that can’t be overlooked.
Personally, I believe that the success or failure of migrating all centralized hosting services to the GRT network by 2023 Q1 might determine the future of GRT.
Conclusion for GRT:
Currently, personally, I don’t find the token particularly appealing. There’s an excessive amount unlocking, too little burning, and structurally, it seems extremely challenging for the price to rise.
However, following the significant reduction in unlocking after the December 17, 2022, turning point, and assuming the successful migration of centralized services in Q1 2023, personally, I see ample potential to achieve the 20% to 30% growth in GRT token as indicated in the spreadsheet. Personally, as we approach the year-end, I’ll likely intensify my tracking efforts into GRT.
Considering its role in Web 3.0, this project could be seen as essential, occupying a distinctive position in that field. With hopes for GRT’s success by the year-end and into Q1 2023, I’ll conclude my thoughts here.
I feel like my thoughts might not have been organized well due as it was more of a self recording diary not a research. Still, thank you for reading this to the end
BQ,